This experiment measures two easy-to-miss performance cliffs in cooperative-vector MLP inference: scalarizing an activation and reading weights from a portable row-major layout.
Experiment setup
| Component |
Configuration |
| GPU |
NVIDIA GeForce RTX 5070 Ti Laptop GPU (GB205, 11 GB) |
| OS and driver |
Windows 11 25H2, NVIDIA 616.56 |
| API and shaders |
Vulkan VK_NV_cooperative_vector, FP16 CoopVec, Slang 2026.14.1 |
| Profiler |
Nsight Graphics 2026.3.1 |
| Measurement |
GPU clocks locked to base; three process runs, each with three warm-ups and ten measured dispatches |
The workload is the complete eight-affine-layer E1/E2/E3/F/S/D/H/O network. Each dispatch evaluates 65,536 fixed inputs 16 times, or 1,048,576 complete network evaluations. All timings below cover the entire inference pass, not an isolated activation or matrix multiply. The reported time is the median of the three run medians.
Bad versus good activation
The bad version explicitly indexes every cooperative-vector component:
for (int lane = 0; lane < N; ++lane)
{
    if (value[lane] < half(0.0))
        value[lane] *= half(0.01);
}
The good version keeps the operation on the cooperative-vector value:
value = max(value, value * half(0.01));
| Full inference pass |
Indexed lanes (bad) |
Native CoopVec (good) |
| Median time |
0.461472 ms |
0.282560 ms |
| Throughput |
2,272.24 M eval/s |
3,710.99 M eval/s |
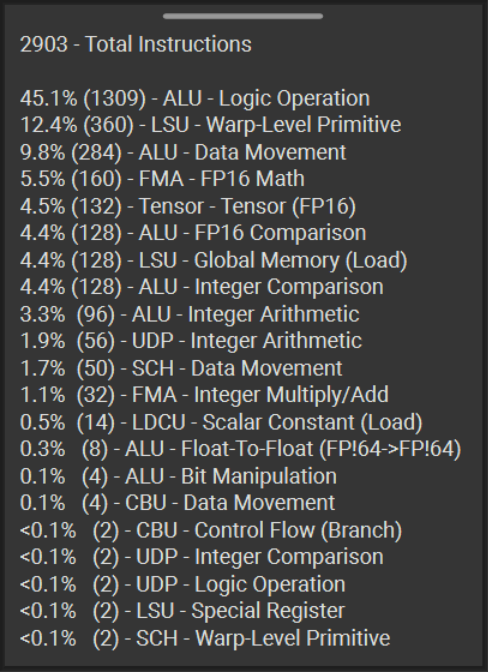
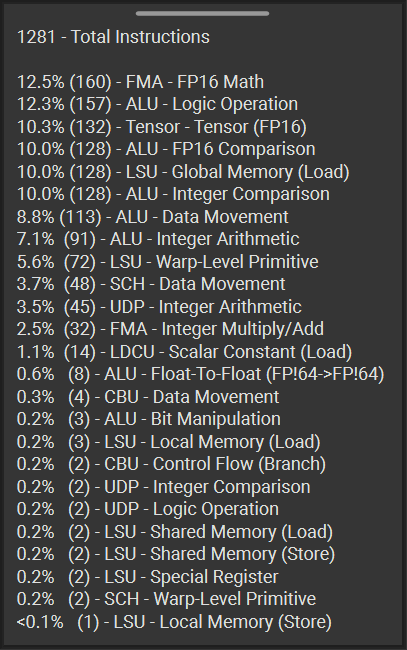
| Total instructions |
2,903 |
1,281 |
| Tensor FP16 instructions |
132 |
132 |
The native expression is 38.77% faster, or 1.633x in throughput. Matrix work did not disappear: both versions contain the same 132 Tensor FP16 instructions and 160 FP16 FMA instructions. The difference is the machinery around the activation:
- ALU logic falls from 1,309 to 157 instructions.
- LSU warp-level primitives fall from 360 to 72.
- ALU data movement falls from 284 to 113.
- Control-flow branches remain at two in both shaders.
The source-level loop is unrolled and largely lowered into predicates, lane movement and logic rather than many literal branch instructions. That work interrupts an otherwise tensor-dominant chain and increases the distance between consecutive matrix operations. A direct vector max gives the compiler and driver a cooperative-vector operation that can remain in the supported representation. This follows the good/bad pattern shown in the SIGGRAPH 2026 Introduction to Neural Shading course.
 |
 |
| Indexed-lane activation |
Native cooperative-vector activation |
Row-major versus InferencingOptimal weights
InferencingOptimal does not change the network or activation. Before inference, the same FP16 row-major matrices are converted once into an opaque, device-dependent weight layout. The Vulkan specification deliberately leaves the packing implementation-defined; applications query its size and convert it with vkConvertCooperativeVectorMatrixNV or vkCmdConvertCooperativeVectorMatrixNV. Matrix stride is ignored for an optimal layout. See the VkCooperativeVectorMatrixLayoutNV reference and the VK_NV_cooperative_vector proposal.
| Full inference pass |
RowMajor + native |
InferencingOptimal + native |
| Median time |
0.282560 ms |
0.267936 ms |
| Throughput |
3,710.99 M eval/s |
3,913.53 M eval/s |
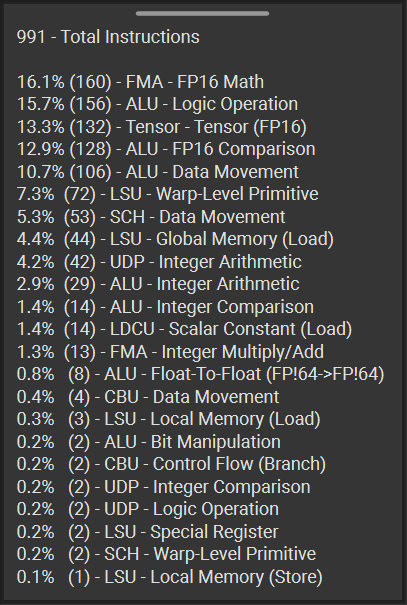
| Total instructions |
1,281 |
991 |
| Global-load instructions |
128 |
44 |
| Dynamic global sectors |
428.316 M |
250.353 M |
| SM throughput |
79% |
83% |
| L1TEX throughput |
68% |
33% |
The optimal layout reduces pass time by 5.18% and global sectors by 41.55%. The main static reductions are global loads (128 -> 44), integer comparisons (128 -> 14), integer arithmetic (91 -> 29) and integer multiply/add (32 -> 13). Tensor FP16 remains at 132 instructions, so this is a data-delivery improvement rather than less neural-network math.
The throughput counters tell the same story. NVIDIA describes SM throughput as the pressure on shader execution pipelines, including ALU, FMA and FP16/Tensor work. L1TEX contains the SM’s L1 data cache plus its load/store and texture pipelines. A throughput percentage is proximity to a unit’s sustained peak, not a cache hit rate or an efficiency score; a lower number is beneficial when the same useful work also finishes sooner. See the Nsight Graphics system architecture guide and Nsight metrics explanation.
Here, the opaque weight layout removes a large amount of L1-served weight traffic, so L1TEX pressure drops from 68% to 33%. With fewer load and address instructions surrounding the same Tensor work, the SM reaches a higher fraction of its sustained pipeline rate over elapsed cycles: throughput rises from 79% to 83%. The two changes together indicate a better balance between data delivery and matrix computation.
The eight-matrix conversion cost was approximately 0.0086 ms and is paid only when the canonical weights change. It is not included in the steady-state inference numbers above.